Guide: Tracking sales performance in the retail sector

How to monitor sales performance in the retail sector?

Margot Bonhomme
December 17, 2023 - 7 min reading

Retail is a demanding and competitive sector: brands seek to gain distribution and increase their number of points of sale, but unfortunately the size of the shelves remains the same...

And yet, this is the place to be: over 90% of household purchases are made in the major chains.

It's a war of positions between manufacturers. In an average hypermarket, where more than 20,000 SKUs can coexist, according to Nielsen, it's vital to focus on measurable, actionable data to develop market share and sales.

Together, we're going to explore the essential KPIs to track for a supermarket brand, those that will help you understand and boost your sales performance. With the right use of data, every figure becomes a tool to optimize your presence and strengthen your brand's position.

Pre-requisites before following your data

Before you have KPIs, you have raw data. This raw data is collected by your sales reps during their sales rounds. So you're not there to check that it's in. And yet, having confidence in your data is essential: if you're not sure that your data is reliable, how can you interpret it? How can you make decisions based on it?

It is therefore important to ensure the reliability of your collected data, in particular through :

  • use of CRM/SFA software;
  • the use of personalized forms specialized for your sector/brand;
  • validation of data entered by your sales force: the statement is not taken into account until the data has been validated;
  • conditional response forms, which simplify the task of your area managers;
  • features such as voice note-taking and photos, making it easier to enter information.

And now that you're sure your collected data is correct, let's take a look at the KPIs to track.

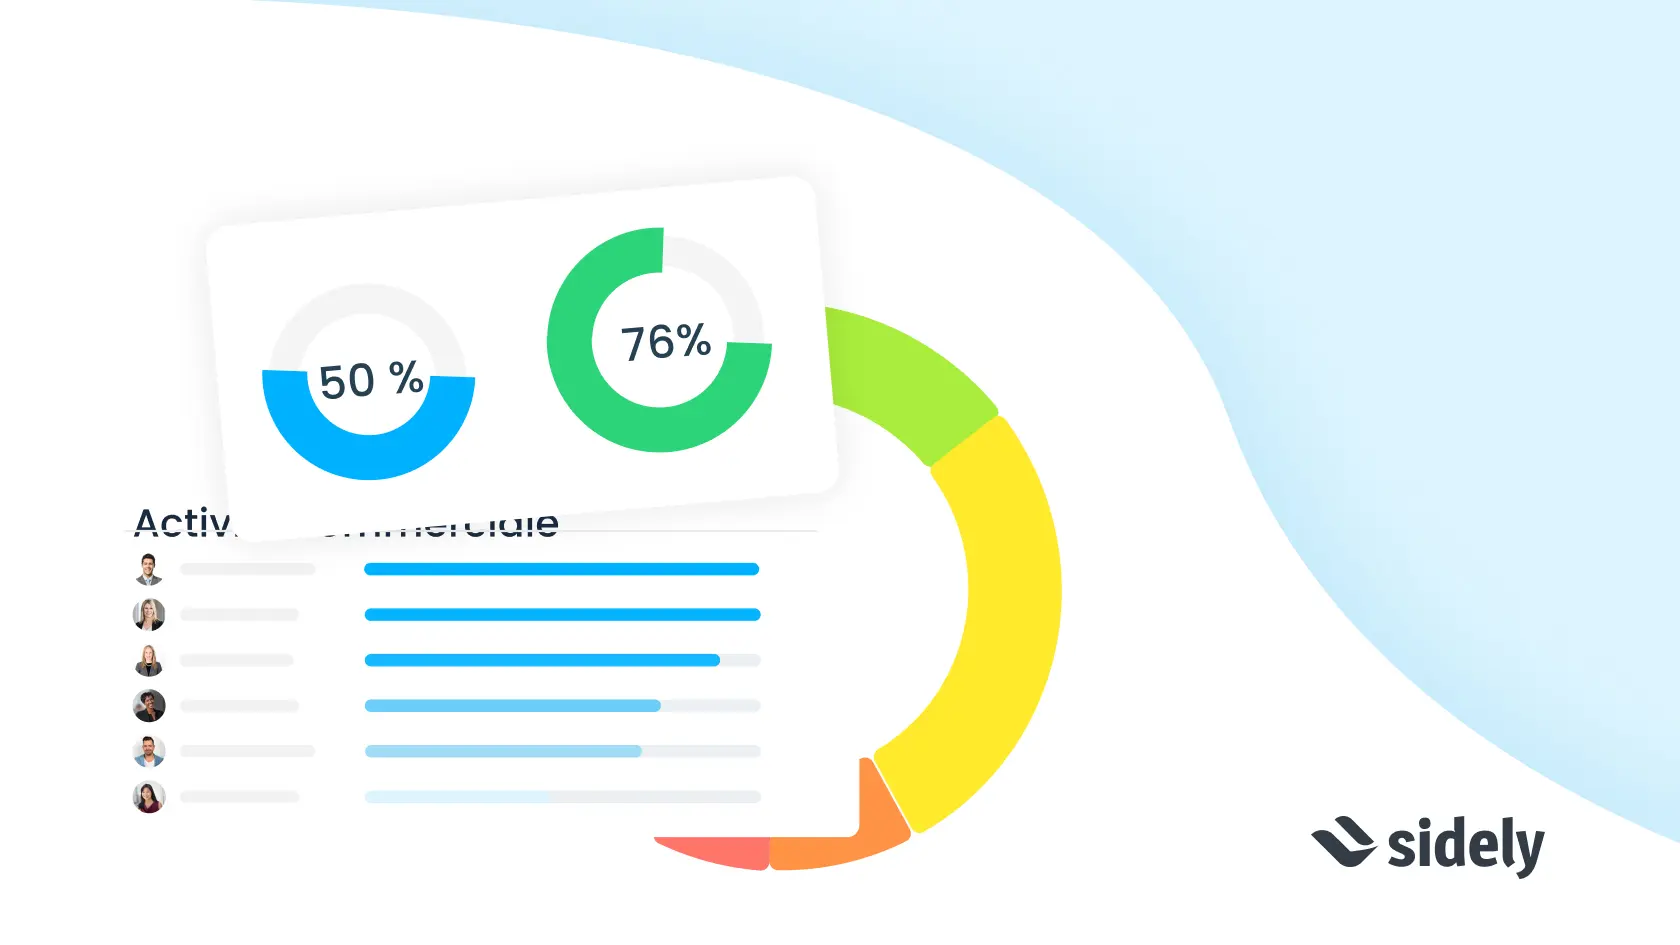
Tracking the right KPIS in supermarkets enables us to anticipate and react quickly to changing trends and consumer expectations. More than a measurement, KPIs are an indicator of success and a guide to strategic decisions.

The KPIS to follow for a mass-market brand

Performance in retail is linked to a precise and rigorous analysis of key performance indicators (KPIs). It is based on your main levers (the 4Ps) implemented in the field by your sales team.

At Sidely, we have segmented the KPI approach into six crucial areas:

  1. Sales performance
  2. Store and brand performance
  3. Promotional performance
  4. Search engine optimization performance
  5. Merchandising performance
  6. Sales and order performance

Tracking sales performance

Sales force optimization

Sales activities include all events and actions carried out by the field sales force: visits, calls, tasks...

Keeping a close eye on these activities helps optimize the efficiency of teams in the field, and maximize the return on investment of promotional campaigns. Studies have shown thatsales people who follow a defined plan increase their productivity by an average of 20%.

Recommended KPIs include :

  • Events per point of sale, i.e. the sum of events carried out over a defined date range, per store. Tracking sales actions enables us to assess their impact and detect growth opportunities.
  • Events per salesperson, i.e. the sum of events carried out over a defined date range, per salesperson. Evaluating individual performance helps identify training needs and align personal objectives with corporate strategies.

It is also interesting to track the evolution of events by sales outlet, over a given time granularity. This is particularly relevant in the case of new store openings, innovation launches or targeted promotional campaigns. This enables you to understand the direct impact of these initiatives on in-store traffic, and also to validate that your sector managers have indeed increased the number of visits to your retailers.

Finally, tracking the evolution of events by salesperson offers a clear view of individual performance, providing essential data to ensure that everyone is fulfilling their missions.

By analyzing these metrics, you can identify strengths and areas for improvement, pinpoint training and development needs, and ensure that sales efforts are aligned with your brand's strategic objectives.

Tracking the performance of stores and banners

Point of sale activation and optimization

Points of Sale are your stores. Their segmentation is a practice that enables a refined analysis of the performance of each business unit. This methodology, corroborated by data from the Fédération du Commerce et de la Distribution (FCD), which states that an optimized store can generate a significant increase in sales, of the order of 15 to 25%, highlights the crucial importance of such an approach.

By segmenting your stores by status, such as priority stores (also known as gold), new customers, or active customers, you can not only assess the level of importance and potential of each outlet, but also fine-tune your marketing and distribution strategies accordingly.

Moreover, tracking the evolution of these statuses provides valuable data on the lifecycle of your distributor relationships.

  • Active stores represent opportunities for consolidation and sales growth;
  • New customer categorization is used to evaluate the effectiveness of acquisition efforts and understand the evolution of your customer base;
  • Identifying lost customers and stores to reactivate is crucial to developing retention and re-engagement strategies;
  • Etc.

Tracking promotion performance

Evaluating the effectiveness of promotional campaigns

Promotion is a marketing action that stimulates sales of a product or product category in a store or group of stores, over a given period.

Different strategies/mechanisms can be used to promote products at point-of-sale. So it's important to understand which ones work for your brand.

The success of your promotions depends on two factors:

  • How you or your area managers managed to sell the promotion (central or pirate);
  • How the animation went and its results.

These strategies are often supported by advertising (POS), goodies and/or animations at point of sale and/or in the media (radio, social networks), billboard advertising, etc.

To track the results of your in-store promotion, you need to check whether it led to an increase in recurring sales (VMH, VMM), but you can track several other KPIs:

  • Promotion conversion rate: this KPI measures the percentage of customers who have purchased a product on promotion compared with the total number of customers exposed to the promotion. A high conversion rate indicates an effective and attractive promotional campaign;
  • Promotional ROI: This evaluates the financial efficiency of promotions by comparing the gains generated with the initial investment. It is crucial in determining whether promotional expenditure results in a net profit;
  • Promotional sales increase: this KPI tracks the impact of promotions on sales of a specific product. A noticeable increase in your sales during the promotional period means that the campaign attracts customers' attention and stimulates purchases;
  • Impact on customer loyalty: One of the risks of promotion is the stock effect. Your loyal customers will buy volume and then stop consuming your brand for a long time, eliminating the usual recurrence. By analyzing buying habits before, during and after promotions, you can assess whether promotional campaigns help build customer loyalty or increase purchase frequency;
  • Promotional sales as a proportion of total sales: this KPI enables us to understand what proportion of overall sales is attributable to promotions. A balance is needed to avoid over-reliance on promotions;
  • The average duration of promotional stocks: Measuring the time it takes to clear promotional stocks offers insights into the match between the promotional offer and consumer demand;
  • Out-of-stock rate during promotions: A high out-of-stock rate may indicate underestimation of demand or poor inventory management, while a low rate suggests good planning;
  • Cost per acquisition (CPA) during Promotion: CPA measures the total cost to acquire a new customer via a promotional campaign. A low CPA indicates high marketing effectiveness;
  • Post-promotion attrition rate: This KPI tracks the number of customers who stop buying after a promotion has ended. A high rate may indicate that promotions attract mainly bargain-seeking buyers, with no long-term loyalty, which is not what your brand is aiming for.


Tracking SEO performance

Maximizing product and brand presence

The presence of your products at point-of-sale is a crucial indicator that can directly influence your sales and, consequently, your brand's overall performance. Tracking it allows you to identify where your products are present, and therefore understand the right activation of your stores.

To measure the presence of your products, you can track several KPIs:

  • Numerical retention (D.t.N): This key indicator compares the number of products actually present in a sales outlet with the number provided for in the mandatory assortment.D.t.N can be analyzed by product, category, brand, store or chain. For example, it's a good idea to analyze it by product if you're launching a new innovation, or by store if you want to analyze your new outlets;
  • Product holdings: the sum of SKUs that are present in the store. This indicator reflects the variety of your product offering and its ability to meet consumers' diverse expectations;
  • Digital Distribution (DN): This KPI measures the number of stores that carry at least one of your SKUs across your entire customer base;
  • Active customers: Tracking the number of active stores on your customer base, helps you identify your sales front;
  • Coverage rate: This is the number of surveys carried out on all your visited points of sale. A decisive KPI for judging the effectiveness of field operations;
  • Number of compulsory references: This is the sum of the products in the compulsory assortment that should be present. This data is a compliance indicator, showing whether the assortment has been respected.

It's crucial not only to measure these KPIs, but also to understand their evolution over time. This gives you a less static picture of your relationships with your distributors.

  • Evolution of ownership and distribution by sales outlet. This enables you to measure the performance of your brands and stores;
  • Evolution of your holdings by product. This enables you to measure the performance of your categories and references.

For brands operating on a multi-brand or multi-radius basis, it is pertinent to compare and analyze ownership and distribution by brand or department. This will give you a more macro picture of your presence and help you refine your sales strategies.


Monitor merchandising performance

Ensuring the visibility of your products

Merchandising encompasses all the strategies and techniques used to present your products attractively at the point of sale. At Sidely, we take an in-depth approach to merchandising, leveraging accurate data collected in the field to go beyond traditional merchandising practices.

Effective merchandising is crucial, as it can influence up to 70% of in-store purchasing decisions, according to studies carried out by POPAI.

Here are the essential elements to keep an eye on for effective merchandising:

  • Price survey: Check that your prices are correctly displayed, and at the right rate. Compare the prices of your products with those of your competitors to ensure competitive pricing;
  • Merchandising audit: check the presence and location of your merchandising to ensure that it is visible and accessible;
  • POS (point-of-sale advertising) presence: Assess what percentage of your promotional materials are visible at the point of sale;
  • Label visibility: Determine the percentage of your price or information labels that are correctly displayed;
  • Number of facings: Count the number of your products displayed facing the customer on the shelf;
  • Shelf positioning: note the height at which your products are placed, which can affect their visibility;
  • LMP (Least Consequence Price): Monitor the lowest price at which a product is sold, which can influence purchasing decisions;
  • Out-of-stock rate: Measure how often your products are out of stock, which can lead to lost sales;
  • Weekly Average Sales (VMH): Track the regular sales performance of your products to anticipate demand;
  • Merchandising trends by store and product: Analyze how merchandising for each product is evolving in different stores to identify trends and opportunities for improvement.


Using a digital solution that allows you to easily export all your reports is essential. This ensures autonomous management of your data, and helps you make informed decisions based on detailed, up-to-date analyses of your merchandising strategy.

Monitor sales and order performance

Understanding your actual sales


Sales and orders are the financial reflection of your business. By focusing on sell-in, which measures direct sales to distributors, brands gain an initial perspective of their sales performance. However, to capture the full economic picture, it's imperative to track sell-out, i.e. actual sales to end-consumers from checkouts.


Market studies show that brands that succeed in fine-tuning their sell-out strategy can achieve sales growth of 10-15%. To flesh out this financial analysis, several KPIs are essential:

  • The average basket, in value and volume, provides a measure of the amount and quantity of products purchased on average per transaction. It is a significant indicator of overall performance and the effectiveness of promotional actions;
  • Orders placed with chains and/or stores provide an insight into the level of demand and the interest of sales outlets for the brand's products;
  • Average weekly sales by brand or store, as well as by product or category, provide a detailed analysis of consumer trends and product popularity;
  • Sales trends by outlet reveal the successes or difficulties of certain locations, enabling optimized allocation of marketing and sales resources;
  • Sales trends by product or category help to identify the best-performing ranges or those requiring strategic intervention;
  • The sell-out by brand or store sheds light on how effectively products are sold to end consumers, which can influence future orders;
  • The evolution of sell-outs by brand or store makes it possible to track sales progression over time, and identify seasonal trends or the effects of promotional campaigns.

If you're in any doubt as to why checkouts are essential for identifying sales dynamics in supermarkets, our article on how to obtain and analyze your check outs can take the guesswork out of the equation.

How can this data be used to make informed decisions?

The CRM solution that accompanies you on a daily basis is essential for in-depth analysis of your field and sales data.

The limitations of tools such as Excel, which can quickly become complex and unwieldy for large amounts of data, underline the need for a more robust solution.

Here are three essential tips for getting the most out of your CRM right from the start:

  1. Prioritize data quality.
  2. Strategically select the data to be analyzed.
  3. Monitor the activity of your sales teams.


Data
cleansing

Clean data is essential for successful analysis. A consistent database will produce consistent results:

  • Associate each store with its brand name, identifying relationships between parent and subsidiary companies;
  • Ensure that your data status is always up to date;
  • Categorize your companies and contacts with relevant tags.

Regular maintenance is essential to ensure that your database is reliable and up-to-date, which in turn is essential for accurate reporting and effective monitoring of your business.

Data selection and filtering

Avoid overwhelming yourself with too much irrelevant data. It's wiser to focus on a small number of well-analyzed key KPIs than to have a multitude of poorly managed data.

We suggest :

  • Filter your data in your reports: Choose the relevant variables according to the trends you wish to observe. In your reports, determine by column the data you want to track;
  • Create customized views: Use advanced filters to segment the stores you want to work on or analyze.For example, create a view that encompasses your stores to visit. Filter by visit frequency or visit delay. You'll have a view of the priority stores to visit during your area managers' next rounds.All views are possible: You can also create a view with your holdings per outlet or the downward or upward trend of your sell-outs.

These optimized views can also be used by your sales teams to improve their organization. They'll save you and them time.

Evaluating sales force performance

Tracking sales performance is just as crucial as tracking sales. They are the source of your data, so it's essential to ensure the quality of their work. A Numerical Distribution (ND) of 88% based on two statements is significantly different from a ND of 88% based on fifty statements.

Sales performance indicators to monitor include :

  • The number of readings per salesperson.
  • The ratio between the number of readings and the number of visits carried out.
  • Analysis of their time management through the diary.
  • Verify their presence in the field, in case of doubt.

It's also crucial to share the data and insights gained from your analyses with the whole team, to optimize the organization and implement the necessary corrective actions.

In short, sales performance in retail is not just a question of numbers, but also of detailed analysis of retail KPIs and understanding of their interactions. Using advanced technology to dissect these indicators is essential to convert your data into strategic information.

Ready to conquer the field? 
Try Sidely free for 15 days. 
Request a demo
Ready to conquer the field? 
Request a demo